Architecture as Code: Why Tech Leaders and Engineers Should Adopt Diagrams‑as‑Code Now
Architecture as Code: The Senior Engineer’s Edge in an AI Era
We live in a world of AI. New model update every two weeks, the countdown until the death of the software engineer creeping ever closer. So you can stop reading here.
Why It Matters for Tech Leadership, Engineers, and Recruiters
AI trend: At large enterprises, AI pair programmers now author a material share of net‑new code. GitHub (Microsoft) reports developers accept roughly 30-40% of Copilot suggestions on average, with some languages and teams exceeding 50%. AWS customers using CodeWhisperer report ~57% faster task completion in controlled benchmarks. Net: double‑digit percentages of new production code at big companies are already machine‑generated—and that share is rising—especially in boilerplate‑heavy stacks such as AWS, Microsoft, others.
But writing code is just a small part of software, and the portion that least differentiates engineers. Yes, people will argue about clean code, variable naming, which languages are best. If you can master one of the primary enterprise back-end languages (Java/Kotlin, C++, Go, Ruby), a front end language (JavaScript or TypeScript), and SQL then you have the basic tools you need to be considered full-stack. LLMs are pretty good at generating text, code is a language, and it’s the exact type of content purposed for AI. Now what?
The job of a senior level software engineer (or manager) is to raise the gaze beyond the microservice or JIRA ticket you are currently working on. How should an application flow, what do users expect (requirements), what is the impact on other portions of the business if you make certain decisions? Tradeoffs.
This isn’t a new concept, but it becomes more important — Architecture diagrams as code.
I had a conversation with our principal architect last week and our teams are moving away from visual diagrams such as Gliffy, Miro, or Visio towards text based diagrams such as PlantUML or Mermaid. Each has their place. If you’re presenting to key decision makers or non-technical folks, the visual based diagram is going to be a better fit for your audience. But for technical documents and flow diagrams, text-based proves superior. You can easily embed these in wikis or commit to code in GitHub/BitBucket.
Pros and Cons of Diagrams‑as‑Code
Pros
-
Plain text that diffs cleanly, which makes pull request reviews straightforward.
-
Full version control and change management out of the box — history, blame, and rollback all just work.
-
LLMs and scripts can modify, generate, or interpret them. Fits naturally into “docs‑as‑code.”
-
No vendor lock-in. PlantUML, Mermaid, Graphviz, and the C4 model are all portable and open.
-
CI/CD can auto‑render PNG/SVG/PDF on commit, so your wikis and runbooks stay current without manual effort.
-
Co‑located with code, which means diagrams evolve alongside the system (less diagram rot).
-
Searchable and greppable. When you refactor a service name, you can find it in your diagrams too.
-
You can lint and validate them — enforce naming conventions, boundary rules, and C4 levels programmatically.
-
Every change is traceable to a ticket or ADR, which simplifies governance and audits.
-
A clear hiring signal: recruiters and managers can inspect design artifacts right alongside the code.
Cons
-
The default output isn’t pretty. Theming and spacing take real effort to get right.
-
There’s a learning curve (PlantUML, Mermaid, and C4 each have their own syntax quirks).
-
Non‑technical audiences often prefer polished visuals, so these won’t replace your executive slide decks.
-
Toolchain friction is real — local renderers, CI renderers, fonts, and Graphviz versions can all drift apart.
-
Large diagrams get unreadable fast. You need discipline to modularize into separate views.
-
Real‑time collaboration doesn’t match whiteboards or Miro for early-stage ideation.
-
Without wiring diagrams into the dev workflow, they go stale and start misleading people.
-
Internal topology could leak if repos or artifacts are exposed. Treat diagram source like you treat code.
-
Accessibility (color, contrast) suffers unless you pay explicit attention to it.
Examples and Workflow
a CRUD case for example
Diagram with User (API call) to console (front-end) which calls back-end service connected to DB. Hosted on AWS, chosen just because its 30% of the market.
PlantUML
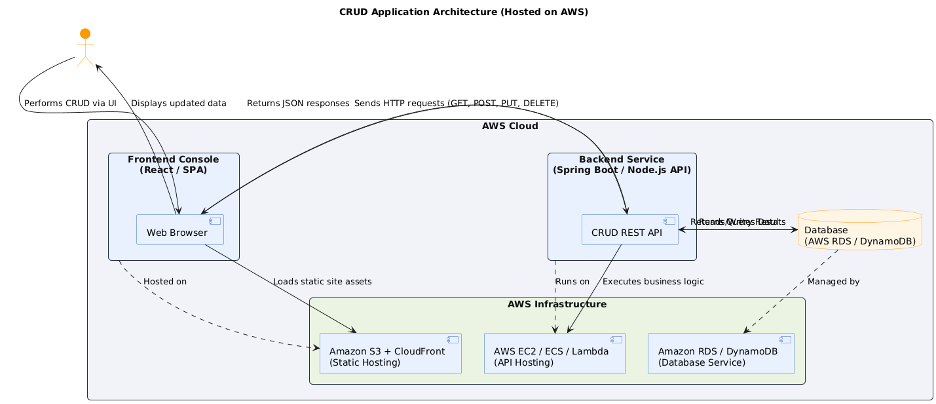
You can copy this code into any PlantUML viewer or .puml file.
Also here’s a link to the documentation
Mermaid
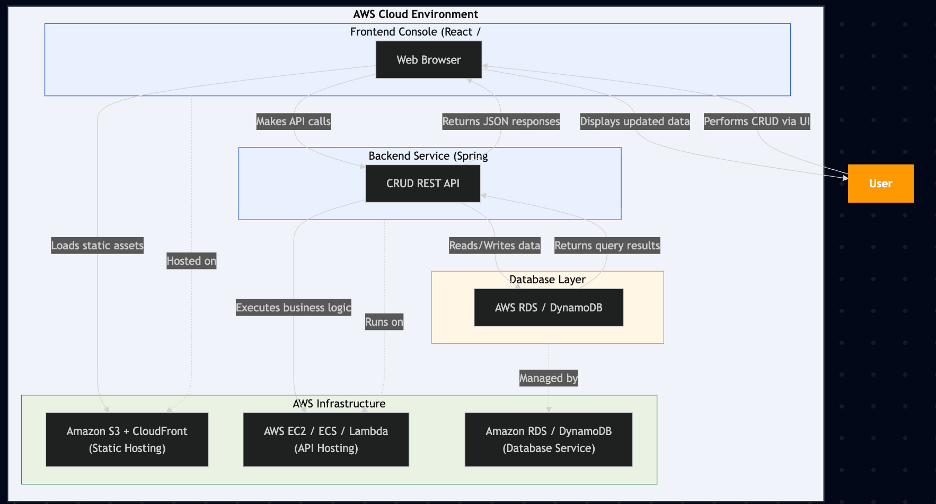
You can render this directly in:
Markdown files (GitHub, GitLab, Obsidian, Notion, etc.)
Static site generators like Docusaurus or Astro (just use ```mermaid blocks)
In-browser visualizers like Mermaid Live Editor
To learn more, visit the documentation
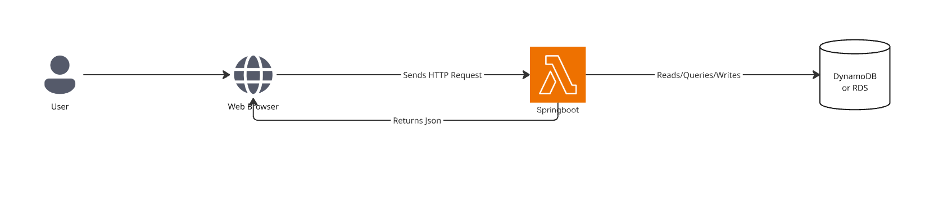
Miro
This demo was created using the free, single-user version of Miro so please excuse the lack of visual detail. Updating the diagram is cumbersome: any change requires reopening Miro, manually editing the content, and potentially granting other users access. Unlike text-based diagrams, there’s no version-controlled, automated way to propagate updates.
Diagramming tools like Miro, Gliffy, or Visio give you richer visual polish and an intuitive drag-and-drop experience, but they drift out of sync with the code they describe. Architecture-as-Code approaches — PlantUML or Mermaid — sacrifice some design flair for precision, version control, and automation. There’s a learning curve, but the payoff is diagrams that stay maintainable over time. And you get to use your AI buddy to help generate them.
The last diagram you hand-drew on a whiteboard six months ago? Nobody updated it. Text-based diagrams wired into CI don’t have that problem.
How to Adopt It This Quarter
Just before year end is the perfect time to implement new practices ahead of Q1 next year.
-
Pick one area to diagram (System context, service boundaries, data flow, deployment topology).
-
Author a PlantUML or a Mermaid version (Use PlantUML for enterprise or JVM-heavy systems, and Mermaid for Markdown/JS-based projects) and add to vsc of your codebase.
-
Add a CI job to render PNG/SVG and publish to your wiki/README on every merge to main.
-
Gate merges on a simple diagram linter.
-
Review in sprint demos with engineering and product.
Start this week. Convert one architecture diagram to code, put the renders in CI, and review it in your next PR. If it reduces drift and speeds up decisions, standardize it across the org. The future of architecture is text — make it a habit.
Get posts like this in your inbox
Bi-weekly emails on automation, AI, and building systems that run without you. No fluff.
No spam. Unsubscribe anytime.
Related Articles
The AI Coding Model Wars: How Open Source Is Closing the Gap on Proprietary Coding Models
February 15, 2026
Four major coding models launched in six days. The benchmark gap? 2.6 points. The price gap? 45x. A head-to-head comparison of Opus 4.6, Codex 5.3, GLM-5, and Kimi K2.5.
AI Model Selection: Choosing the Right Model and Application Pattern
February 3, 2026
Not all tasks need the most powerful AI model. Learn how to match model intelligence to task complexity and stop overpaying for sledgehammers when you need scalpels.
Prompt Engineering Tips for Tech Leaders
October 30, 2025
A pragmatic guide to prompt engineering for tech leaders and engineers. Learn durable patterns, ROI-focused choices, and a full before/after example.
Wrestling with a technical challenge?
I help companies automate complex workflows, integrate AI into their stacks, and build scalable cloud architectures.